PAPUA
NEW GUINEA
Mine Overview
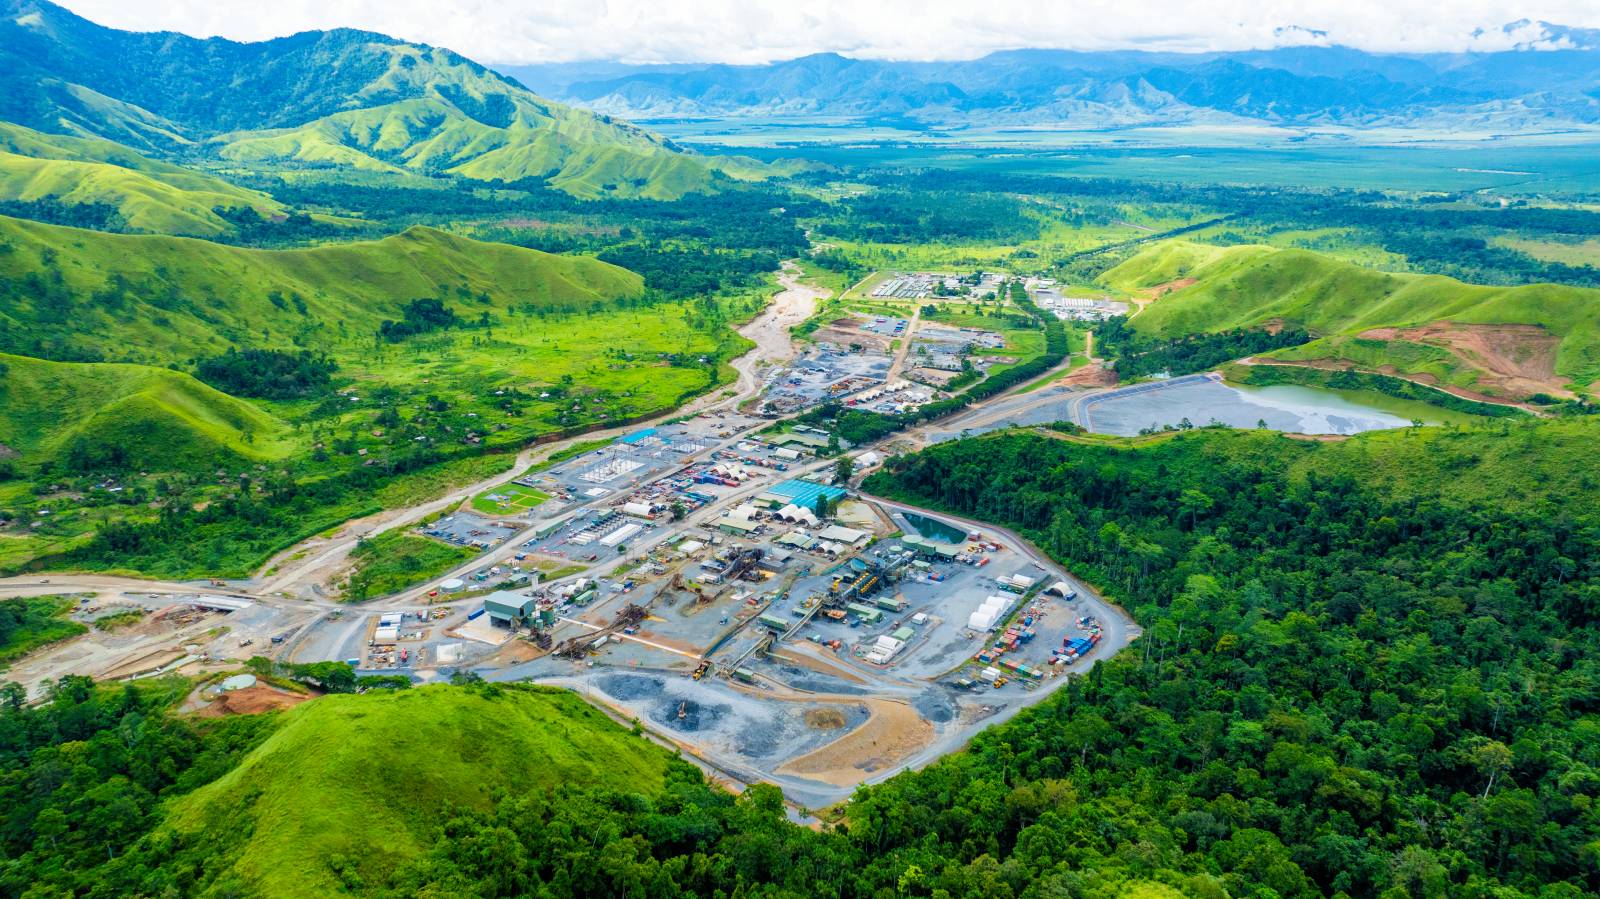
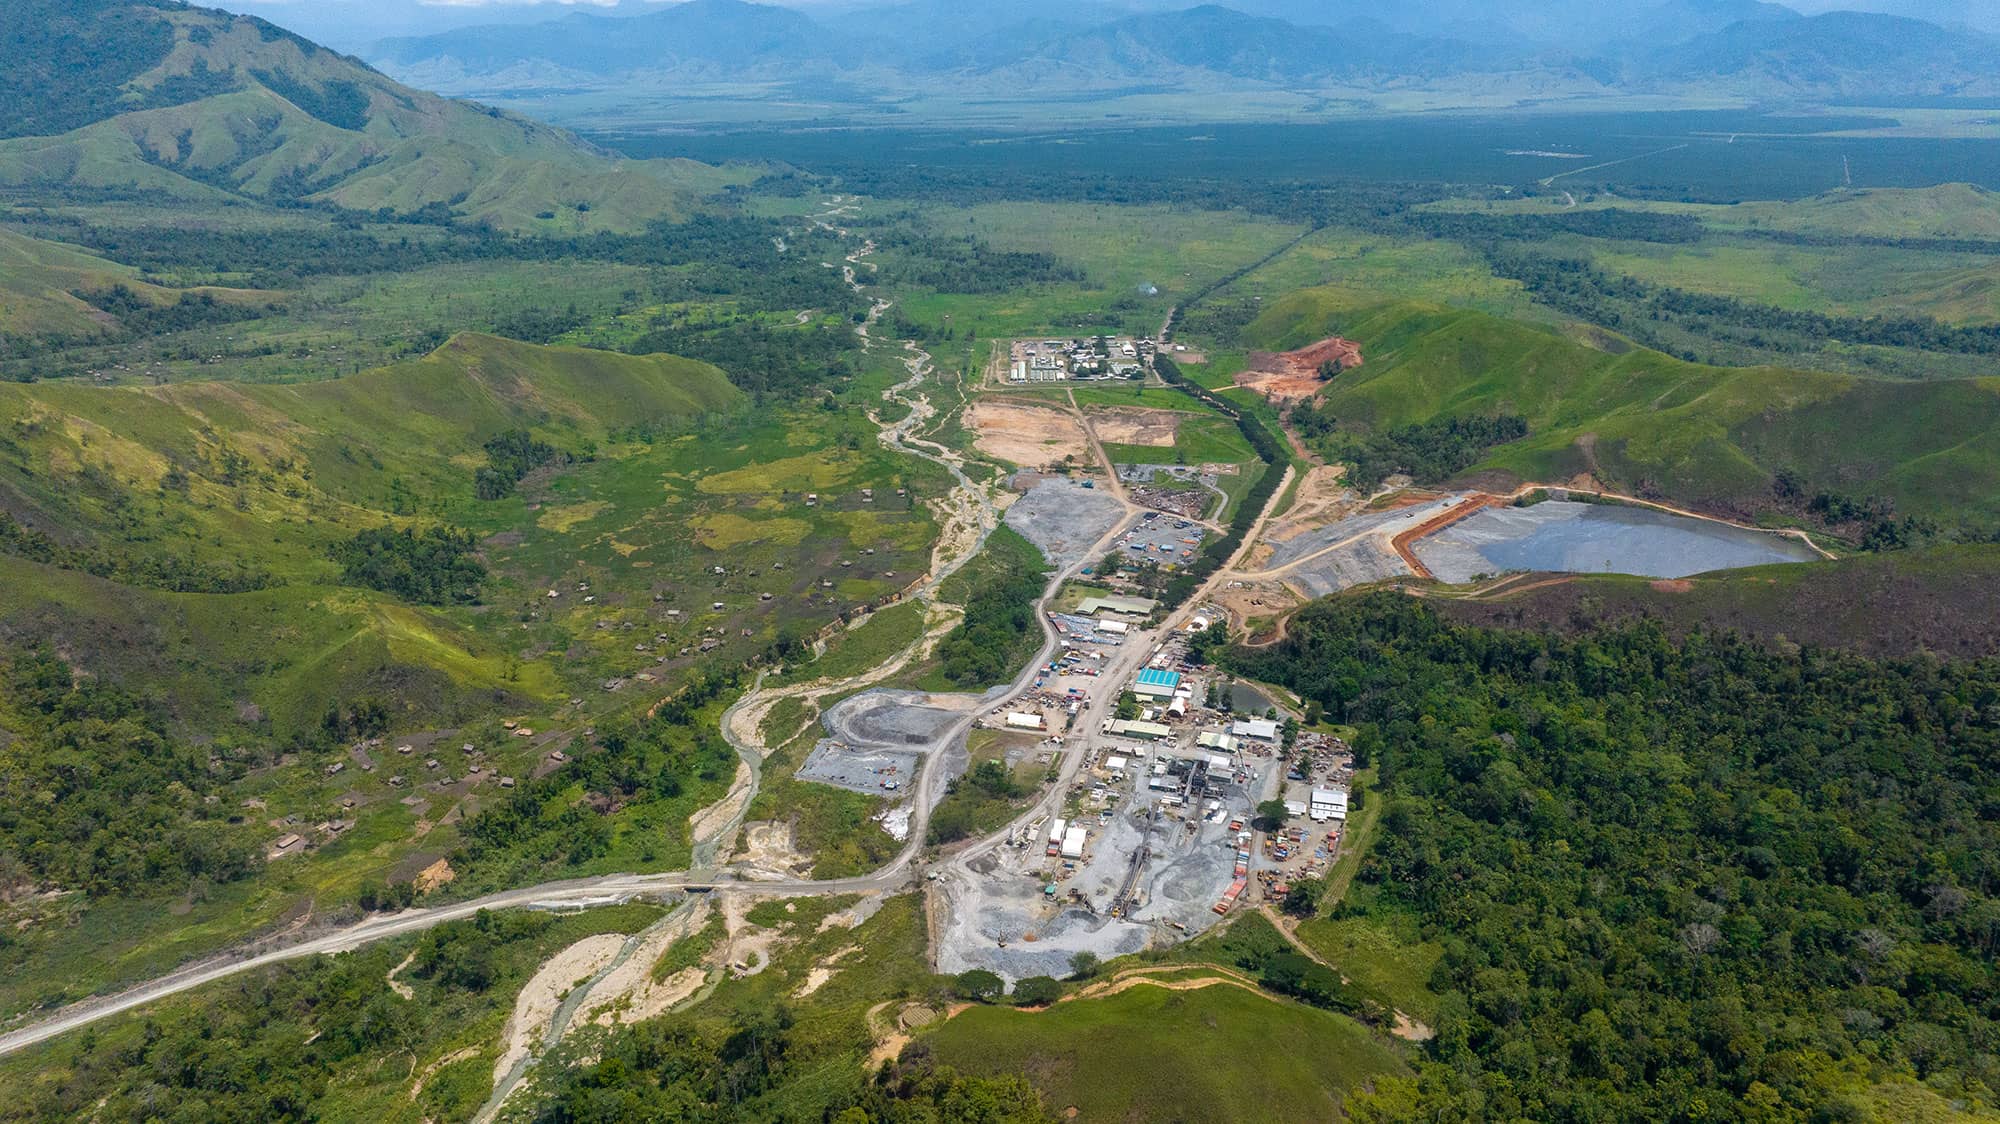
K92 operates and is expanding the Kainantu Gold Mine, located in the Eastern Highlands Province of Papua New Guinea. Since acquiring the project from Barrick Gold in 2014 and restarting operations in late 2016, it has transformed Kainantu into a long-life producer supported by a substantial and expanding mineral resource base.
Kainantu’s low-cost production reflects the high grade, continuity, thickness, favourable geotechnical conditions and strong metallurgical characteristics of the deposit. This growth has been driven by a series of near-mine exploration discoveries supported by existing infrastructure.
Kora–Judd Discovery and Resource Growth
In May 2017, the near-mine discovery of Kora North marked a pivotal milestone. This discovery ultimately connected the Kora, Eutompi and Kora North deposits into what is now known as the Kora deposit.
2023 Resource Update
Following extensive underground drilling K92 announced its latest combined Kora and Judd mineral resource in December 2023. Thus far, the discovery cost has been achieved at less than US$7.50 per ounce gold equivalent. The combined Kora and Judd resource increased to:
- Measured & Indicated: 8.1 Mt at 10.00 g/t AuEq for 2.6 Moz AuEq.
- Inferred: 16.5 Mt at 8.48 g/t AuEq for 4.5 Moz AuEq.
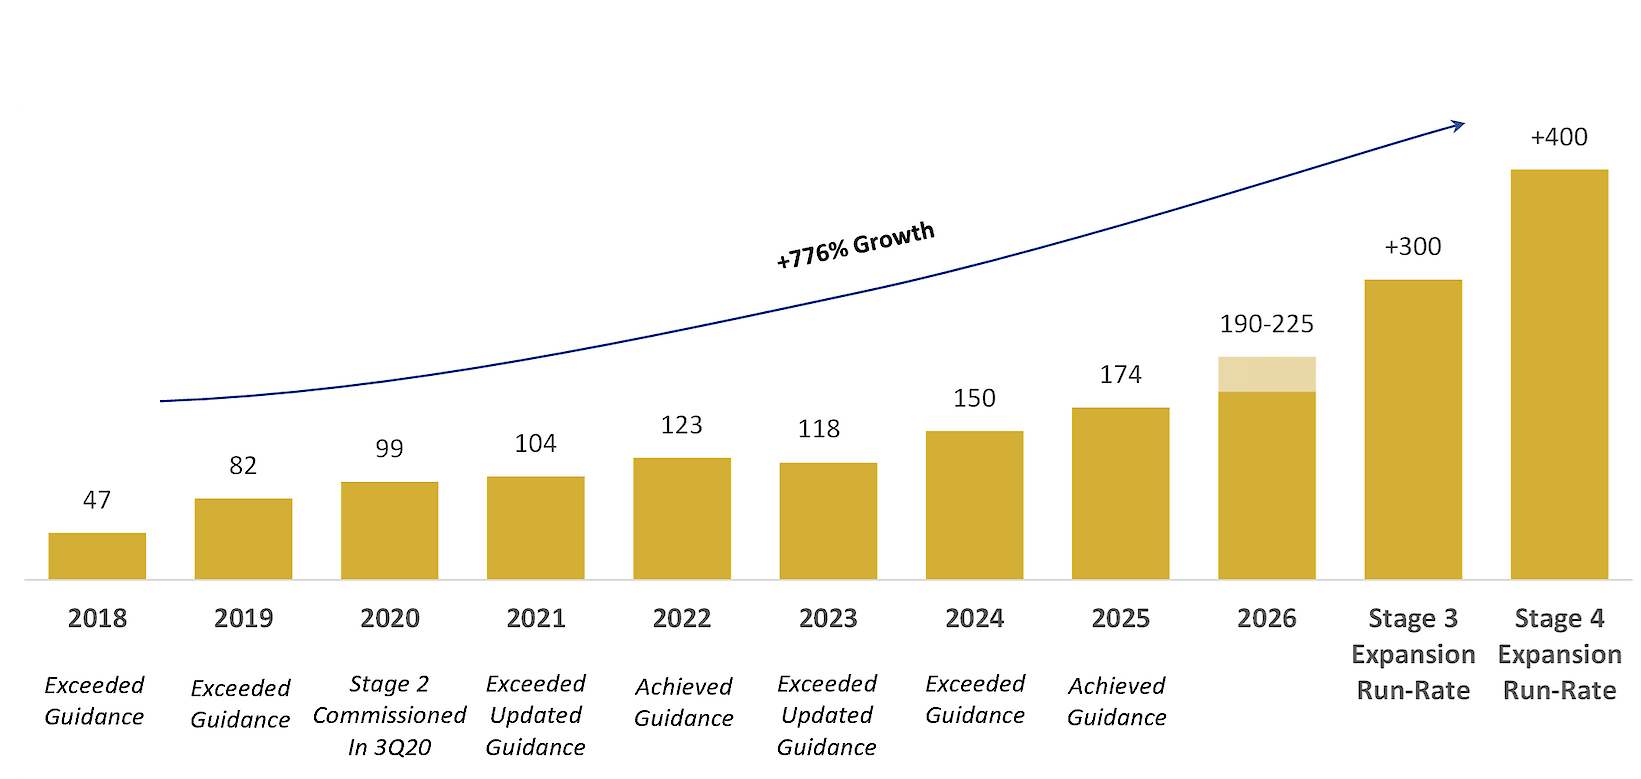
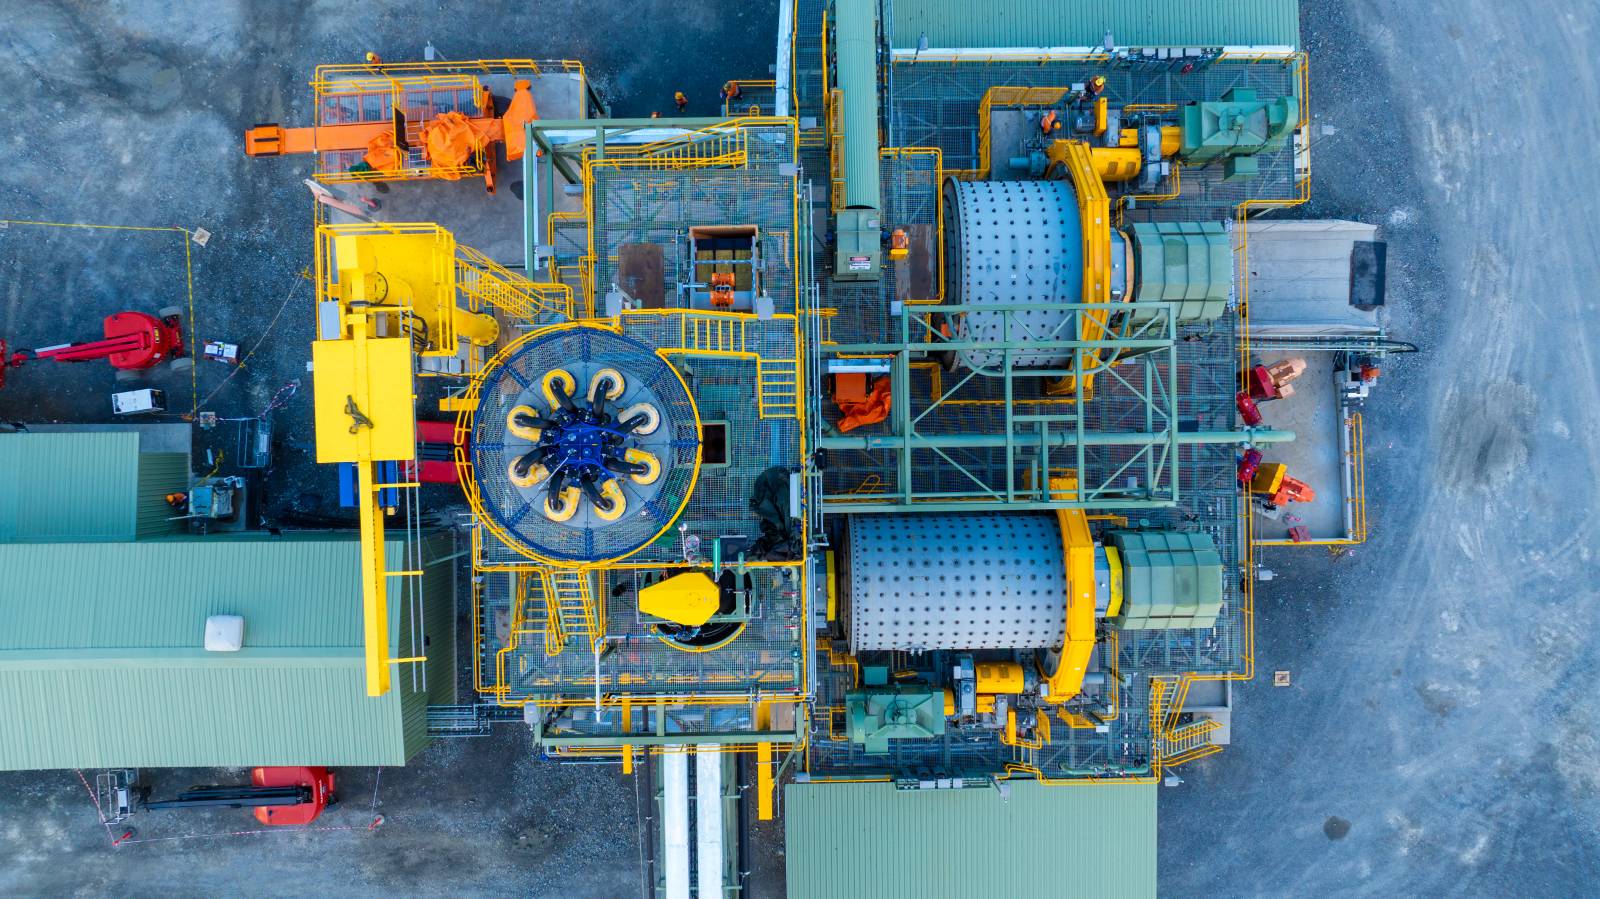
Expansion Strategy and Production Growth
K92 is executing a staged expansion strategy to transform Kainantu into a Tier 1 gold-copper operation:
- Stage 2 Expansion: Run-rate achieved in late 2021, doubling throughput to 400 ktpa
- Stage 2A Expansion: Completed in May 2023, increasing throughput to +600,000 tpa, upgraded from 500,000 tpa
- Stage 3 Expansion: Construction and commissioning complete, increasing underground mine throughput to 1.2 mtpa
- Stage 4 Expansion: Plant expansion scheduled for commissioning in the second half of 2027, increasing throughput to 1.8 mtpa.
As outlined in the October 2024 Updated Definitive Feasibility Study, Stage 3 is expected to achieve Tier 1 production of +300 koz AuEq per annum run-rate, with life-of-mine average all-in sustaining costs of US$665/oz net of by-products or US$920/oz on a co-product basis.
K92 is also planning a Stage 4 Expansion targeting run-rate of +400 koz AuEq per annum production through low-capex upgrades to the Stage 3 plant, with the Stage 2A plant remaining available to support future phases of expansion¹.
Exploration Upside
Exploration is self-funded and remains a major focus, with up to 14 drill rigs operating across multiple targets.
At Arakompa, located ~4.5 km from the Stage 3 plant, one of our highest-priority high-grade vein systems, drilling continues to demonstrate mineralization along a known +2 km strike length, with a maiden mineral resource estimate targeted for mid-2026.
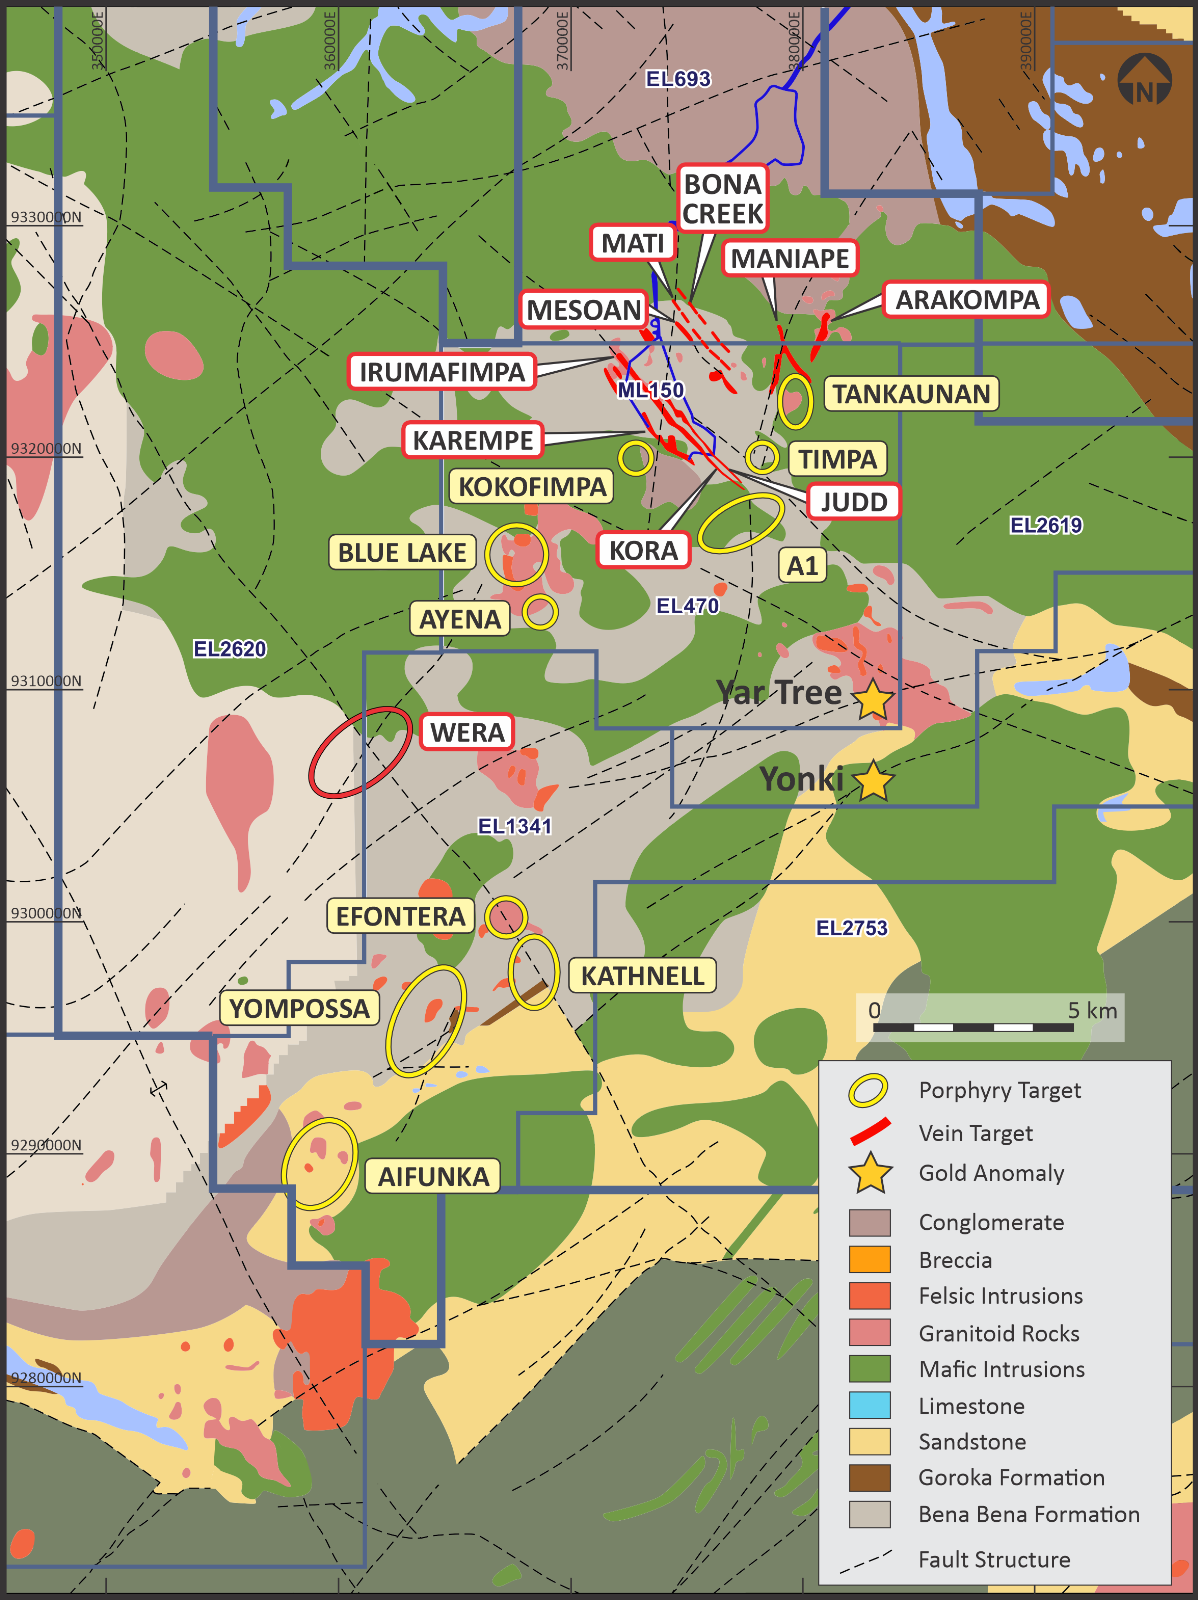
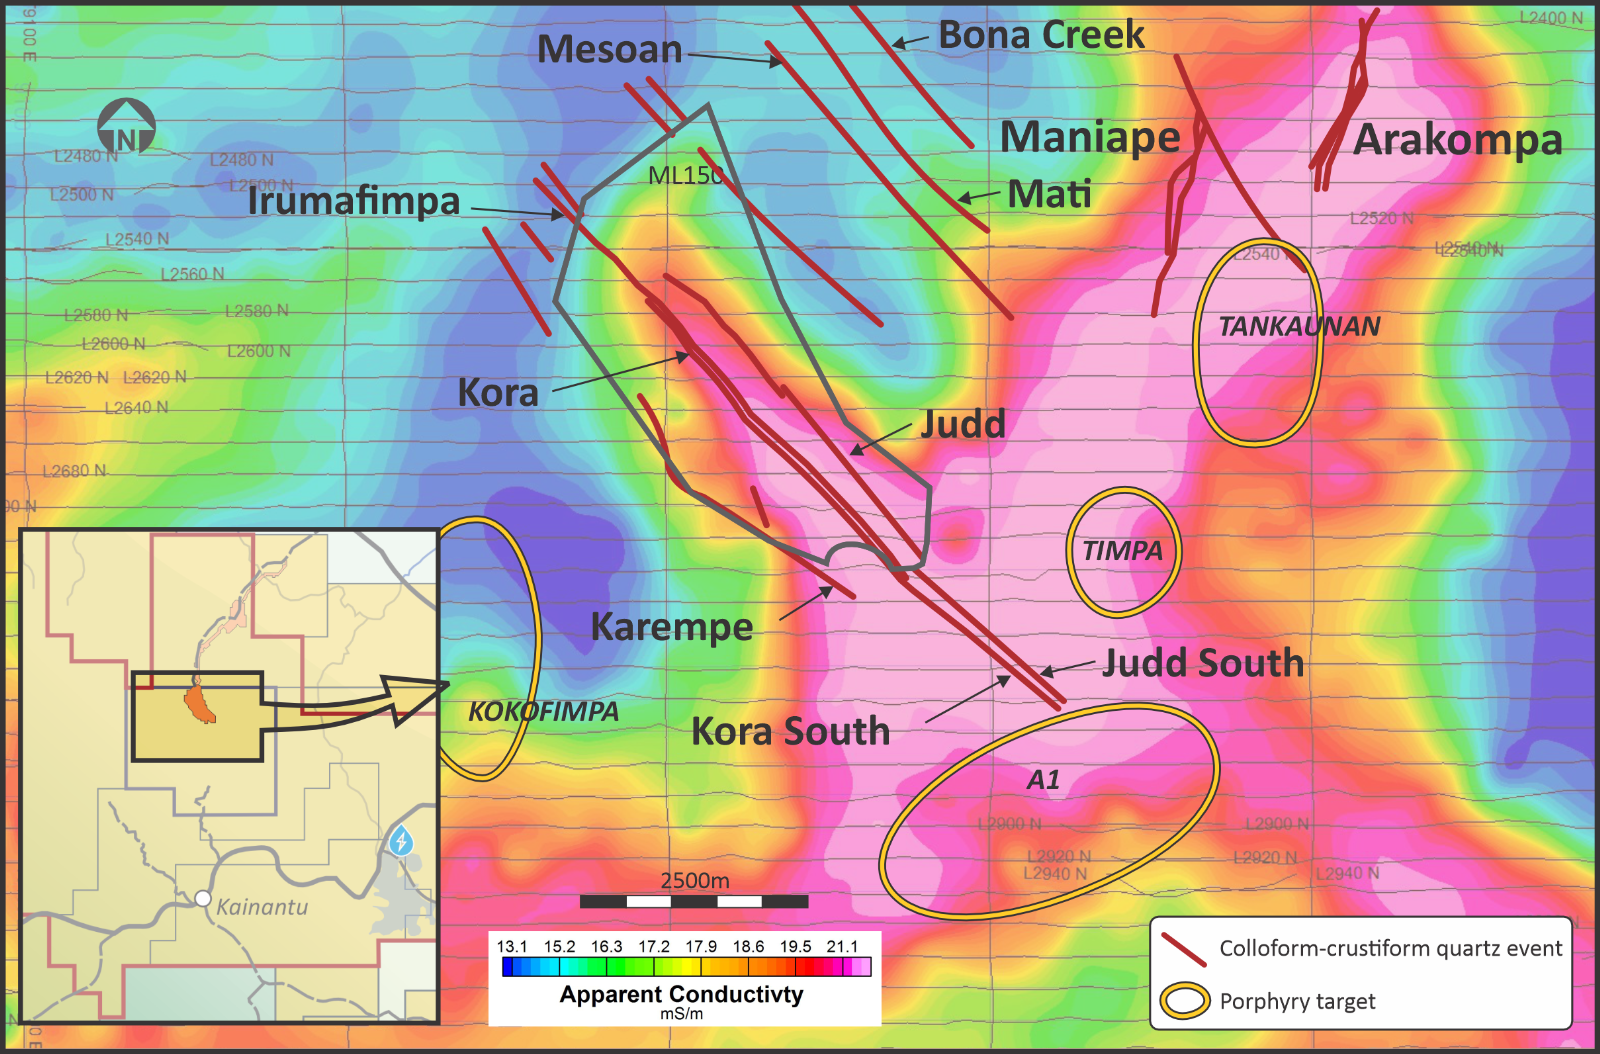
District-Scale Opportunity
Kainantu sits within a large ~830 km² land package in a region known for large Tier 1 gold assets. The property hosts multiple highly prospective vein field and porphyry targets, with several targets being drill tested concurrently.
Note (1): Refer to the technical report titled “Independent Technical Report, Kainantu Gold Mine, Updated Definitive Feasibility Study, Kainantu Project, Papua New Guinea”, with an effective date of January 1, 2024.
Kainantu Achievements and Milestones
Oct 2024
Updated Kainantu Definitive Feasibility Study (Stage 3 and Stage 4 Expansions)Feb 2024
Significant Maiden Drilling Results From ArakompaDec 2023
Kora and Judd Resource Update – 2.6 Moz AuEq M&I, 4.5 Moz AuEq InferredMay 2023
600ktpa, Stage 2A Expansion AchievedDec 2022
Extension to Mining Lease 150 to June 2034Sept 2022
Kainantu Definitive Feasibility Study (Stage 3 and Stage 4 Expansions)Feb 2022
Kora Resource Update and Maiden Judd Resource - 2.3 Moz AuEq M&I, 2.6 Moz AuEq InferredOct 2021
500ktpa, Stage 2A Expansion AnnouncedSep 2021
400ktpa, Stage 2 Expansion AchievedSep 2020
Stage 2 Expansion CommissionedJuly 2020
1mtpa, Stage 3 Expansion PEAMay 2020
Resource Update - 1.3 Moz AuEq Measured & Indicated, 3.9 Moz AuEq InferredMar 2019
400ktpa, Stage 2 Expansion AnnouncedJan 2018
Commercial Production DeclaredMay 2017
Kora North DiscoveryOct 2016
Stage 1 Production Restart - 200ktpaSTAGE 3 DFS EXPANSION SUMMARY(1)
| MINE LIFE & MATERIAL MOVEMENTS | Stage 3 DFS | |
| Mine Life | 7 Years | |
| Throughput | 1.2 mtpa | |
| Total Ore Mined | 6.2 mt | |
| LOM AVERAGE GRADES | ||
| Gold Grade | 6.7 g/t | |
| Copper Grade | 1.0% | |
| Silver Grade | 19 g/t | |
| AuEq Grade | 8.5 g/t | |
| AVERAGE RECOVERIES | ||
| Gold Recovery | 93% | |
| Copper Recovery | 94% | |
| ANNUAL PRODUCTION (AuEq) | ||
| Stage 3 Run-Rate | 303 koz | |
| LOM Avg | 223 koz | |
| Peak | 319 koz | |
| COSTINGS | ||
| Expansion Capex | $194M | |
| Sustaining Capex | $337M | |
| Avg Unit Costs | $145/t | |
| LOM Avg Cash Cost (co-product) |
$694/oz | |
| LOM Avg Cash Cost (net of by-product) |
$380/oz |
|
| LOM Avg AISC (co-product) |
$920/oz | |
| LOM Avg AISC (net of by-product) |
$665/oz |
|
Note (1): Refer to the technical report titled “Independent Technical Report, Kainantu Gold Mine, Updated Definitive Feasibility Study, Kainantu Project, Papua New Guinea”, with an effective date of January 1, 2024.


