K92 Announces Further High-Grade Kora Drill Results From Kora Northern Extension
- Drill Hole KMDD0102 records multiple intersections including 9.85 m at 9.12 g/t Au, 8 g/t Ag and 1.03% Cu (10.8 g/t AuEq) plus 2.20 m at 31.89 g/t Au, 97 g/t Ag and 0.05% Cu (33.18 g/t AuEq) plus 3.36 m at 11.37 g/t Au, 85 g/t Ag and 2.72% Cu (16.61 g/t AuEq)
- Drill Hole KMDD0100 records multiple intersections including 4.10 m at 8.41 g/t Au, 7 g/t Ag and 0.65% Cu (9.49 g/t AuEq) plus 6.84 m at 6.91 g/t Au, 6 g/t Ag and 0.16% Cu (7.24 g/t AuEq)
- Drill Hole KMDD0101 records 8.58 m at 7.23 g/t Au, 13 g/t Ag and 1.22% Cu (9.27 g/t AuEq) plus 8.25 m at 5.91 g/t Au, 7 g/t Ag and 0.49% Cu (6.76 g/t AuEq)
VANCOUVER, British Columbia, Oct. 09, 2018 (GLOBE NEWSWIRE) -- K92 Mining Inc. (TSX-V: KNT; OTCQX: KNTNF) (“K92” or the “Company”) is pleased to announce results from the continuing diamond drilling of the Kora North Extension.
| ||||||||||
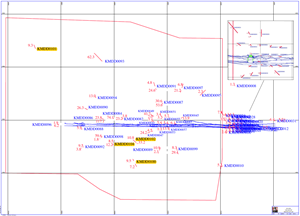
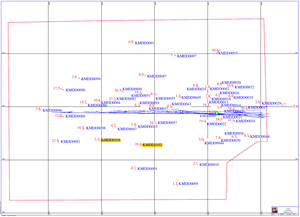
The results from Diamond Drill Cuddies 3 and 4 (DDC3 and DDC4) continue to extend both the K1 and K2 lodes while also further delineating the KL structure and confirming its continuity. See Table 1 below for a summary of drill results including true widths. Long sections showing all holes drilled to date in both K1 and K2 is provided below.
John Lewins, K92 Chief Executive Officer and Director, states, “These results, which form part of the database being used for a resource update of the Kora North Deposit currently under way, have again reinforced the continuity of the strike and vertical extent of both the K1 and K2 vein systems.”
Table 1 provides a summary of the results from KMDD0100, 101, 102 and 104 diamond drill holes drilled from DDC3 and 4. Note that KMDD0101 was terminated prior to the projected intersection of K2 due to slow penetration rates through wet broken ground. Table 2 provides details of collar location and hole orientation.
Table 1 Kainantu Gold Mine – Significant Intercepts from Diamond Drill Cuddies 3 and 4
| Hole_id | From (m) | To (m) | Interval (m) | True width (m) | Gold g/t | Silver g/t | Copper % | Gold equiv g/t | Comment |
| KMDD0100 | 77.00 | 81.10 | 4.10 | 1.86 | 8.41 | 7 | 0.65 | 9.49 | Drilled from DDC3 |
| Including | 77.00 | 77.78 | 0.78 | 0.35 | 30.30 | 5 | 0.57 | 31.23 | |
| Including | 77.78 | 78.46 | 0.68 | 0.31 | 1.80 | 5 | 0.14 | 2.08 | |
| Including | 78.46 | 78.99 | 0.53 | 0.24 | 0.41 | 17 | 0.49 | 1.38 | |
| Including | 78.99 | 79.50 | 0.51 | 0.23 | 9.40 | 2 | 0.19 | 9.71 | |
| Including | 79.50 | 79.80 | 0.30 | 0.14 | 7.24 | 9 | 0.76 | 8.52 | |
| Including | 79.80 | 80.75 | 0.95 | 0.43 | 0.58 | 6 | 0.00 | 0.66 | |
| Including | 80.75 | 81.10 | 0.35 | 0.16 | 5.42 | 11 | 4.36 | 12.23 | |
| KMDD0100 | 88.13 | 94.97 | 6.84 | 2.79 | 6.91 | 6 | 0.16 | 7.24 | |
| Including | 88.13 | 89.26 | 1.13 | 0.51 | 0.66 | 5 | 0.30 | 1.19 | |
| Including | 89.26 | 90.15 | 0.89 | 0.40 | 16.15 | 10 | 0.28 | 16.71 | |
| Including | 90.15 | 91.15 | 1.00 | 0.45 | 0.72 | 3 | 0.01 | 0.77 | |
| Including | 91.15 | 91.90 | 0.75 | 0.34 | 1.40 | 2 | 0.01 | 1.44 | |
| Including | 91.90 | 93.00 | 1.10 | 0.50 | 15.32 | 2 | 0.03 | 15.39 | |
| Including | 93.00 | 93.50 | 0.50 | 0.23 | 7.46 | 3 | 0.37 | 8.06 | |
| Including | 93.50 | 94.00 | 0.50 | 0.23 | 7.64 | 29 | 0.12 | 8.19 | |
| Including | 94.00 | 94.97 | 0.97 | 0.44 | 4.48 | 5 | 0.42 | 5.18 | |
| KMDD0100 | 96.75 | 102.10 | 5.35 | 2.42 | 1.36 | 4 | 0.57 | 2.27 | |
| Including | 96.75 | 97.75 | 1.00 | 0.45 | 3.20 | 3 | 1.53 | 5.57 | |
| Including | 97.75 | 98.84 | 1.09 | 0.49 | 0.12 | 1 | 0.08 | 0.26 | |
| Including | 98.84 | 99.87 | 1.03 | 0.47 | 0.74 | 6 | 1.04 | 2.40 | |
| Including | 99.87 | 100.90 | 1.03 | 0.47 | 0.58 | 8 | 0.26 | 1.07 | |
| Including | 100.90 | 102.10 | 1.20 | 0.54 | 2.14 | 1 | 0.08 | 2.28 | |
| KMDD0101 | 162.00 | 170.58 | 8.58 | 3.35 | 7.23 | 13 | 1.22 | 9.27 | Drilled from DDC4 |
| Including | 162.00 | 162.28 | 0.28 | 0.11 | 23.00 | 4 | 0.36 | 23.61 | |
| Including | 162.28 | 162.53 | 0.25 | 0.10 | 3.28 | 61 | 1.98 | 7.08 | |
| Including | 162.53 | 163.00 | 0.47 | 0.18 | 0.14 | 1 | 0.35 | 0.68 | |
| Including | 163.00 | 163.80 | 0.80 | 0.31 | 0.30 | 3 | 0.92 | 1.75 | |
| Including | 163.80 | 164.22 | 0.42 | 0.16 | 12.87 | 5 | 0.41 | 13.57 | |
| Including | 164.22 | 164.87 | 0.65 | 0.25 | 1.30 | 1 | 0.14 | 1.53 | |
| Including | 164.87 | 165.30 | 0.43 | 0.17 | 19.60 | 8 | 0.75 | 20.85 | |
| Including | 165.30 | 166.10 | 0.80 | 0.31 | 12.19 | 6 | 0.61 | 13.20 | |
| Including | 166.10 | 166.40 | 0.30 | 0.12 | 0.36 | 1 | 0.10 | 0.52 | |
| Including | 166.40 | 166.60 | 0.20 | 0.08 | 27.60 | 7 | 1.14 | 29.43 | |
| Including | 166.60 | 166.88 | 0.28 | 0.11 | 3.25 | 3 | 0.69 | 4.34 | |
| Including | 166.88 | 167.43 | 0.55 | 0.21 | 7.03 | 6 | 0.91 | 8.50 | |
| Including | 167.43 | 168.28 | 0.85 | 0.33 | 1.78 | 17 | 0.82 | 3.24 | |
| Including | 168.28 | 168.63 | 0.35 | 0.14 | 0.93 | 21 | 1.65 | 3.73 | |
| Including | 168.63 | 169.00 | 0.37 | 0.14 | 3.75 | 106 | 7.67 | 16.83 | |
| Including | 169.00 | 169.35 | 0.35 | 0.14 | 1.55 | 12 | 1.03 | 3.28 | |
| Including | 169.35 | 169.92 | 0.57 | 0.22 | 1.72 | 8 | 1.60 | 4.27 | |
| Including | 169.92 | 170.58 | 0.66 | 0.26 | 22.60 | 10 | 2.39 | 26.38 | |
| KMDD0102 | 51.60 | 61.45 | 9.85 | 6.93 | 9.12 | 8 | 1.03 | 10.80 | Drilled from DDC3 |
| Including | 51.60 | 52.70 | 1.10 | 0.77 | 27.30 | 17 | 3.44 | 32.78 | |
| Including | 52.70 | 53.25 | 0.55 | 0.39 | 6.12 | 8 | 0.62 | 7.17 | |
| Including | 53.25 | 54.00 | 0.75 | 0.53 | 18.40 | 13 | 2.26 | 22.02 | |
| Including | 54.00 | 55.10 | 1.10 | 0.77 | 1.51 | 4 | 0.15 | 1.79 | |
| Including | 55.10 | 56.45 | 1.35 | 0.95 | 0.17 | 2 | 0.12 | 0.38 | |
| Including | 56.45 | 57.55 | 1.10 | 0.77 | 0.38 | 5 | 0.37 | 1.00 | |
| Including | 57.55 | 58.33 | 0.78 | 0.55 | 7.44 | 7 | 4.18 | 13.92 | |
| Including | 58.33 | 59.25 | 0.92 | 0.65 | 0.35 | 11 | 0.14 | 0.70 | |
| Including | 59.25 | 60.30 | 1.05 | 0.74 | 1.62 | 7 | 0.11 | 1.88 | |
| Including | 60.30 | 61.45 | 1.15 | 0.81 | 28.30 | 9 | 0.07 | 28.53 | |
| KMDD0102 | 63.80 | 66.00 | 2.20 | 1.55 | 31.89 | 97 | 0.05 | 33.18 | |
| Including | 63.80 | 64.65 | 0.85 | 0.60 | 20.10 | 13 | 0.05 | 20.34 | |
| Including | 64.65 | 65.26 | 0.61 | 0.43 | 38.10 | 151 | 0.04 | 40.07 | |
| Including | 65.26 | 66.00 | 0.74 | 0.52 | 40.30 | 148 | 0.05 | 42.26 | |
| KMDD0102 | 72.33 | 73.60 | 1.27 | 0.89 | 1.58 | 57 | 3.51 | 7.68 | |
| Including | 72.33 | 72.75 | 0.42 | 0.30 | 1.89 | 93 | 6.25 | 12.63 | |
| Including | 72.75 | 73.60 | 0.85 | 0.60 | 1.43 | 39 | 2.16 | 5.23 | |
| KMDD0102 | 118.64 | 122.00 | 3.36 | 1.73 | 11.37 | 85 | 2.72 | 16.61 | |
| Including | 118.64 | 119.27 | 0.63 | 0.32 | 1.48 | 8 | 0.27 | 1.99 | |
| Including | 119.27 | 120.17 | 0.90 | 0.46 | 32.50 | 302 | 9.39 | 50.70 | |
| Including | 120.17 | 121.00 | 0.83 | 0.43 | 3.17 | 6 | 0.28 | 3.68 | |
| Including | 121.00 | 122.00 | 1.00 | 0.51 | 5.40 | 4 | 0.28 | 5.88 | |
| KMDD0104 | 51.60 | 52.84 | 1.24 | 0.93 | 8.11 | 2 | 0.26 | 8.54 | Drilled from DDC3 |
| Including | 51.60 | 52.36 | 0.76 | 0.57 | 13.16 | 2 | 0.39 | 13.79 | |
| Including | 52.36 | 52.84 | 0.48 | 0.36 | 0.12 | 1 | 0.06 | 0.22 | |
| KMDD0104 | 57.20 | 61.00 | 3.80 | 2.84 | 12.02 | 4 | 0.12 | 12.25 | |
| Including | 57.20 | 58.19 | 0.99 | 0.74 | 26.10 | 7 | 0.26 | 26.58 | |
| Including | 58.19 | 59.00 | 0.81 | 0.61 | 0.86 | 2 | 0.04 | 0.95 | |
| Including | 59.00 | 60.00 | 1.00 | 0.75 | 16.66 | 4 | 0.04 | 16.77 | |
| Including | 60.00 | 60.40 | 0.40 | 0.30 | 0.19 | 1 | 0.07 | 0.31 | |
| Including | 60.40 | 61.00 | 0.60 | 0.45 | 4.00 | 3 | 0.15 | 4.26 | |
| KMDD0104 | 71.95 | 78.85 | 6.90 | 5.16 | 5.90 | 4 | 0.17 | 6.21 | |
| Including | 71.95 | 72.83 | 0.88 | 0.66 | 1.41 | 8 | 0.42 | 2.16 | |
| Including | 72.83 | 74.00 | 1.17 | 0.88 | 0.02 | 1 | 0.02 | 0.06 | |
| Including | 74.00 | 75.00 | 1.00 | 0.75 | 0.29 | 2 | 0.11 | 0.48 | |
| Including | 75.00 | 76.00 | 1.00 | 0.75 | 0.26 | 2 | 0.29 | 0.72 | |
| Including | 76.00 | 76.16 | 0.16 | 0.12 | 0.25 | 6 | 0.62 | 1.27 | |
| Including | 76.16 | 76.65 | 0.49 | 0.37 | 0.18 | 2 | 0.07 | 0.32 | |
| Including | 76.65 | 77.95 | 1.30 | 0.97 | 13.12 | 6 | 0.06 | 13.28 | |
| Including | 77.95 | 78.85 | 0.90 | 0.67 | 24.10 | 6 | 0.22 | 24.52 | |
| KMDD0104 | 82.00 | 82.40 | 0.40 | 0.30 | 1.95 | 6 | 2.00 | 5.09 | |
| KMDD0104 | 86.78 | 89.43 | 2.65 | 2.10 | 1.25 | 12 | 0.59 | 2.31 | |
| Including | 86.78 | 87.48 | 0.70 | 0.55 | 3.08 | 11 | 0.32 | 3.70 | |
| Including | 87.48 | 88.40 | 0.92 | 0.73 | 0.11 | 13 | 0.12 | 0.46 | |
| Including | 88.40 | 88.70 | 0.30 | 0.24 | 0.47 | 18 | 0.96 | 2.17 | |
| Including | 88.70 | 89.43 | 0.73 | 0.58 | 1.25 | 9.00 | 1.30 | 3.36 |
Notes:
Gold Equivalent uses Copper price of US$2.90/lb; Silver price of US$16.5/oz and Gold price of US$1300/oz
Table 2 Kainantu Gold Mine – Collar Locations for Kora Underground Diamond Drilling
| Hole_id | Collar location | Collar orientation | EOH depth (m) | Lode | |||
| Local north | Local East | RL | Dip | Local azimuth | |||
| KMDD0100 | 58903.77 | 29869.15 | 1188.89 | -54.6 | 317.5 | 131.5 | Kora |
| KMDD0101 | 58815.00 | 29880.45 | 1196.00 | 58.4 | 218.5 | 221.5 | Kora |
| KMDD0102 | 58904.00 | 29868.97 | 1189.17 | -31.0 | 317.8 | 150.1 | Kora |
| KMDD0104 | 58901.86 | 29868.91 | 1189.52 | -37.0 | 265.0 | 122.0 | Kora |
The current Kora/Eutompi Inferred Resource estimate, as defined by previous drilling to date, is 4.36 million tonnes at a grade of 7.3 g/t Au, 35 g/t Ag and 2.23 percent Cu, or 11.2 g/t gold equivalent (see Table 3) and is open for expansion at depth and in both directions along strike.
K92 has filed and made available for download on the Company's SEDAR profile a technical report titled, "Independent Technical Report, Mineral Resource Update and Preliminary Economic Assessment of Irumafimpa and Kora Gold Deposits, Kainantu Project, Papua New Guinea," with an effective date of March 2, 2017, that provides additional information on the geology of the deposits, drilling and sampling procedures, lab analysis, and quality assurance/quality control for the project, and additional details on the resource estimates.
The preliminary economic assessment (“PEA”) estimates for Kora, based on the current resource estimates (4.36 million tonnes of 7.3 g/t Au, 35 g/t Ag and 2.23 percent Cu):
- Over a nine-year operating life, the plant would treat 3.2 million tonnes averaging 7.1 g/t Au, 25 g/t Ag and 1.7 percent Cu (9.3 g/t AuEq(1));
- This would generate an estimated positive cash flow of $537 million (U.S.) using current metal prices if 15-metre levels are used in mining; if 25-metre levels are used, then net cash flows are estimated as $558 million (U.S.); this cash flow includes conceptual allowances for capital;
- Production of an estimated average of 108,000 AuEq(1) ounces per annum over an eight-year period from year 2 through to year 9;
- An estimated pretax net present value (NPV) of $415-million (U.S.) for 25-metre levels, or $397 million (U.S.) for 15-metre levels, using current metal prices, exchange rates and a 5 percent discount;
- An estimated after-tax NPV of $329 million (U.S.) for 25-metre levels, or $316 million (U.S.) for 15-metre levels, using current metal prices, exchange rates and a 5 percent discount;
- Initial capital cost is estimated to be $13.8 million (U.S.), including the $3.3 million (U.S.) for the plant upgrade identified in the Mincore scoping study, but excluding the proposed Kora exploration inclines and diamond drilling; sustaining capital cost is estimated to a further $64 million (U.S.) spent over the life of the Kora mining for 25-metre levels, or $83 million (U.S.) for 15-metre levels;
- Operating cost per tonne is estimated to be $125 (U.S.) per tonne for 25-metre levels, or $126 (U.S.) per tonne for 15-metre mining levels; and
- Excluding initial capital expenditure of $14 million (U.S.), cash cost is estimated to be $547 (U.S.) per ounce AuEq (inclusive of a 2.5 percent net smelter return (NSR) royalty) and all-in sustaining cost (AISC) of $619 (U.S.) per ounce AuEq for 25-metre mining levels, or $549 (U.S.) per ounce (inclusive of a 2.5 percent NSR royalty) and AISC of $644 (U.S.) per ounce AuEq for 15-metre mining levels.
Metal prices used were $1,300 per ounce for gold, $18 (U.S.) per ounce for silver and $4,800 per tonne for copper.
(1) Gold equivalent calculated on above metal prices.
Kora remains open for expansion in every direction and strongly mineralized at the extent of all drilling.
The PEA is preliminary in nature and includes inferred mineral resources that are considered too speculative geologically to have the economic considerations applied to them that would enable them to be categorized as mineral reserves, and there is no certainty that the PEA will be realized. The technical report contains a full description of all underlying assumptions relating to the PEA. Mineral resources that are not mineral reserves and do not have demonstrated economic viability.
Table 3 IRUMAFIMPA AND KORA/EUTOMPI RESOURCES
| Resource by Deposit and Category | ||||||||||
| Deposit | Resource Category | Tonnes | Gold | Silver | Copper | Gold Equivalent | ||||
| Mt | g/t | MOz | g/t | MOz | % | Mlb | g/t | MOz | ||
| Irumafimpa | Indicated | 0.56 | 12.8 | 0.23 | 9 | 0.16 | 0.28 | 37 | 13.4 | 0.24 |
| Inferred | 0.53 | 10.9 | 0.19 | 9 | 0.16 | 0.27 | 74 | 11.5 | 0.20 | |
| Kora/Eutompi | Inferred | 4.36 | 7.3 | 1.02 | 35 | 4.9 | 2.23 | 215 | 11.2 | 1.57 |
| Total Indicated | 0.56 | 12.8 | 0.23 | 9 | 0.16 | 0.3 | 4 | 13.4 | 0.24 | |
| Total Inferred | 4.89 | 7.7 | 1.21 | 32 | 5.06 | 2.0 | 218 | 11.2 | 1.76 | |
M in Table is millions. Reported tonnage and grade figures are rounded from raw estimates to reflect the order of accuracy of the estimate. Minor variations may occur during the addition of rounded numbers. Gold equivalents are calculated as AuEq = Au g/t + Cu%*1.52 + Ag g/t*0.0141.
In addition to the above Irumafimpa and Kora/Eutompi Resources, K92 has also defined an additional resource at Kora North comprising a Measured Resource of 242,900 tonnes @ 13.9 g/t Au, 19 g/t Ag and 1.0% Cu; an Indicated Resource of 442,800 tonnes @ 11.8 g/t Au, 21 g/t Ag and 1.2% Cu and an Inferred Resource of 1,084,400 tonnes @ 13.2 g/t Au, 15 g/t Ag and 1.0% Cu. See Table 4 below.
Table 4 Kora North Mineral Resource – Effective Date June 25, 2018
| Category | Tonnes | Gold | Silver | Copper | AuEq | ||||
| g/t | Ozs | g/t | Ozs | % | 000's lb | g/t | Ozs | ||
| Measured | 242,900 | 13.9 | 108,400 | 19 | 151,900 | 1.0 | 5,300 | 15.6 | 122,200 |
| Indicated | 442,800 | 11.8 | 168,100 | 21 | 298,100 | 1.2 | 11,900 | 13.9 | 198,300 |
| Total M & I | 685,700 | 12.5 | 276,500 | 20 | 450,000 | 1.1 | 17,200 | 14.5 | 320,500 |
| Total Inferred | 1,084,400 | 13.6 | 509,700 | 15 | 569,600 | 1.0 | 24,400 | 15.2 | 571,000 |
- Gold Equivalent (Au Eq) g/t was calculated using the formula Au g/t + (Cu% x 1.53) + Ag g/t x 0.0127.
- Gold Price US$1,300/oz; Silver US$16.5/oz; Copper US$2.90/lb.
- A top cut of 100 g/t was applied to the gold assays for the K1, K2 KL lodes.
- Mineral Resources which are not Mineral Reserves do not have demonstrated economic viability.
- The estimate of Mineral Resources may be materially affected by environmental, permitting, legal, title, taxation, socio-political, marketing, or other relevant issues.
- The Inferred Mineral Resource in this estimate has a lower level of confidence than that applied to an Indicated Mineral Resource and must not be converted to a Mineral Reserve. It is reasonably expected that the majority of the Inferred Mineral Resource could be upgraded to an Indicated Mineral Resource with continued exploration.
- All material mined from within the resource envelope up to the effective date of the resource have been removed from the model.
- Wireframes were constructed to constrain lode positions based on geological mapping and logging of workings and diamond core coupled with the use of face and drill core assay results using a nominal +1 g/t Au cut-off to define the lode boundary.
- Equal length composites of 0.5m were extracted from the database for each lode. A top cut to gold grade was applied to K2, K1 and KL1 of 100g/t. The ordinary kriging modelling estimation method was then used with search radii of 35m and 130m for Au, Ag and Cu. At least 3 informing values with a maximum of 12 were used to estimate each model block.
- The Resource was classified as measured if both drilling at 25m centres and workings were present, as indicated if only drilling or workings were presented and inferred for material 15m past the last drill hole or working.
K92 Mine Geology Manager and Mine Exploration Manager, Mr. Andrew Kohler, PGeo, a qualified person under the meaning of Canadian National Instrument 43-101 Standards for Disclosure of Mineral Projects, has reviewed and is responsible for the technical content of this news release. Data verification by Mr. Kohler includes significant time onsite reviewing drill core, face sampling, underground workings and discussing work programs and results with geology and mining personnel.
On Behalf of the Company,
John Lewins, Chief Executive Officer and Director
for further information, please contact Investor Relations at +1-604-687-7130.
NEITHER TSX VENTURE EXCHANGE NOR ITS REGULATION SERVICES PROVIDER (AS THAT TERM IS DEFINED IN POLICIES OF THE TSX VENTURE EXCHANGE) ACCEPTS RESPONSIBILITY FOR THE ADEQUACY OR ACCURACY OF THIS RELEASE.
CAUTIONARY STATEMENT REGARDING FORWARD-LOOKING INFORMATION:
This news release includes certain “forward-looking statements” under applicable Canadian securities legislation. Forward-looking statements are necessarily based upon a number of estimates and assumptions that, while considered reasonable, are subject to known and unknown risks, uncertainties, and other factors which may cause the actual results and future events to differ materially from those expressed or implied by such forward-looking statements. All statements that address future plans, activities, events, or developments that the Company believes, expects or anticipates will or may occur are forward-looking information, including statements regarding the realization of the preliminary economic analysis for the Project, expectations of future cash flows, the proposed plant expansion, potential expansion of resources and the generation of further drilling results which may or may not occur. Forward-looking statements and information contained herein are based on certain factors and assumptions regarding, among other things, the market price of the Company’s securities, metal prices, exchange rates, taxation, the estimation, timing and amount of future exploration and development, capital and operating costs, the availability of financing, the receipt of regulatory approvals, environmental risks, title disputes, failure of plant, equipment or processes to operate as anticipated, accidents, labour disputes, claims and limitations on insurance coverage and other risks of the mining industry, changes in national and local government regulation of mining operations, and regulations and other matters.. There can be no assurance that such statements will prove to be accurate, as actual results and future events could differ materially from those anticipated in such statements. Accordingly, readers should not place undue reliance on forward-looking statements. The Company disclaims any intention or obligation to update or revise any forward-looking statements, whether as a result of new information, future events or otherwise, except as required by law.
Photos accompanying this announcement are available at
http://www.globenewswire.com/NewsRoom/AttachmentNg/c65dc225-a24e-43c2-931e-e26565e7ee45
http://www.globenewswire.com/NewsRoom/AttachmentNg/d0d510f0-8459-465f-be90-d301a7eceff0
